¶ Social Media Insights
Social Media Insights
Welcome to the comprehensive guide to Social Media Analytics! This powerful tool enables you to track, measure, and optimize your social media performance with ease. Whether you’re managing campaigns or strategizing content, these analytics provide actionable insights to drive results. Let’s dive into how you can use this feature to its fullest potential.
¶ Overview
Social Media Analytics empowers you to:
- Track posts, likes, comments, followers, impressions, and reach across multiple platforms.
- Visualize performance trends with interactive graphs.
- Dive deep into engagement metrics to optimize content strategies.
- Understand demographic data to better target your audience.
By using this tool, you can transform raw data into meaningful actions that improve your social media presence.
¶ Key Features
¶ Comprehensive Social Media Insights
- Monitor the number of posts, likes, comments, followers, impressions, and reach.
- Visualize trends with interactive graphs showcasing weekly performance.
- Identify your top-performing posts to replicate success.
¶ Engagement Breakdown
- View detailed metrics like total likes, comments, and shares per platform.
- Discover which platform drives more engagement to tailor your strategy.
¶ Impressions and Post Reach
- Measure how many times your posts were displayed on a screen (Impressions).
- Track the number of unique users who saw your posts (Post Reach).
¶ Gender and Age Demographics
- Analyze the gender distribution and age ranges of your audience.
- Optimize your content to suit your audience demographics.
¶ How to Use Social Media Analytics
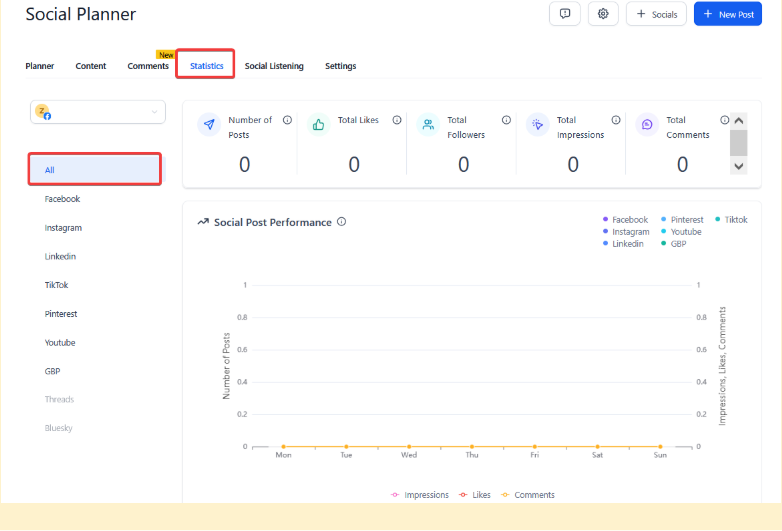
¶ Step 1: Accessing Analytics
- Navigate to the Marketing section from your dashboard.
- SelectSocial Planner and then the Statistics tab.
- Select the platform(s) you want to analyze (e.g., Facebook, Instagram).
¶ Step 2: Understanding Key Metrics
- Published Posts: View the total number of posts published, along with the percentage change compared to the previous week.

- Engagement Details: Check likes, comments, and shares for all posts. A percentage change indicator shows weekly progress.

- Impressions: Monitor the number of times your posts were displayed on a screen, along with weekly comparison percentages.

- Post Reach: See how far your content has spread, including the total number of unique viewers.

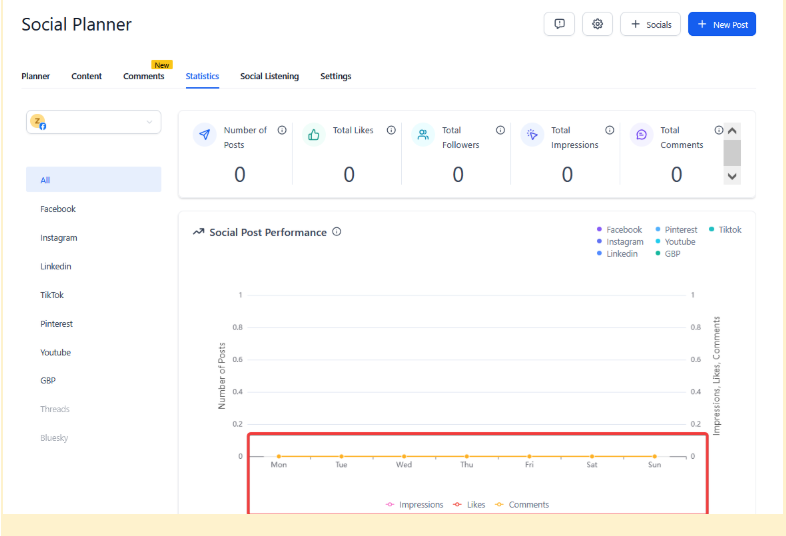
¶ Step 3: Visualizing Trends
- Use the interactive graph to view trends for published posts, likes, comments, and impressions.
- Analyze which days or weeks saw the highest engagement and identify patterns.
¶ Step 4: Viewing Top Performing Posts
- Scroll down to the “Top Performing Posts” table.
- Sort posts by engagement metrics such as likes, comments, or shares.
- Use this data to replicate successful strategies in future posts.

¶ Step 5: Exploring Demographics
- Access the “Gender and Age Demographics” section.
- Review the gender distribution and age range breakdown.
- Adjust your content strategy to better target specific demographics.

Step 6: Analyzing Weekly and Monthly Performance Trends**
While there isn’t a date range filter in theSocial Planner** section, you can still monitor performance over time by using the built-in weekly and monthly comparisons available in the analytics. This allows you to understand trends and measure progress across different periods.
How to Use:
- Navigate to the Social Planner and select the Statistics tab.
- Choose the platform you want to analyze (e.g., Facebook, Instagram).
- View the default weekly comparison of your performance metrics like likes, comments, and impressions.
¶ Real-World Example
Imagine you’ve launched a new product campaign across Instagram and Facebook. With Social Media Analytics, you can:
- Track the total number of posts and their engagement metrics.
- See which platform generated more impressions and reach.
- Use demographic data to identify which audience segments responded best.
- Adjust your strategy based on top-performing posts.
¶ FAQs
Question: What is the difference between Impressions and Post Reach?**
**Answer: Impressions represent the total number of times a post is displayed, while Post Reach is the number of unique users who saw the post.
Question: Why is demographic data missing for some accounts?**
**Answer: Instagram demographics are unavailable for accounts with fewer than 100 followers. Facebook does not provide gender demographics.
Question: How often is the data updated?**
**Answer: Data updates depend on the platform. TikTok and Pinterest data may have delays of 1-2 days due to API constraints.
Question: Can I download reports from Social Media Analytics?**
**Answer: Yes, you can export data reports for detailed offline analysis.
Question: What should I do if analytics data seems inaccurate?**
**Answer: Ensure all connected accounts are active and permissions are granted. Contact support if issues persist.
Question: Can I track both engagement and reach at the same time?**
**Answer: Yes. The analytics dashboard allows you to view engagement metrics (likes, comments, shares) alongside impressions and post reach for a comprehensive performance overview.
Question: Can I change the date range filter to view analytics for a specific custom period?
Answer: No, there is currently no date range filter in the Social Planner section. However, you can monitor your performance over time using the built-in weekly and monthly comparisons to measure progress and identify trends.
Question: Where exactly do I find the Social Media Analytics within the platform?
Answer: Navigate to the Marketing section from your dashboard, select Social Planner , and then click on the Statistics tab.
Question: Can I see which specific days of the week my audience is most active?
Answer: Yes. By using the Visualizing Trends feature, you can use interactive graphs to see which specific days or weeks saw the highest spikes in engagement, helping you identify posting patterns that work.