The Reporting Tab includes a specific report on your Google Ads data. If you’ve integrated a Google Account and are using Google Ads, you can view your ad data here.
Note: To view the Reporting for the Google ads, please make sure that the Google account you are connecting is also registered on the Google Ads platform and has maximum permissions as an administrator.
On the main Dashboard, look for the “Reporting” tab in the left-hand menu and click on it.
In the Reporting section, you’ll see a list of Integrated Platforms. Click on “Google Ads Report” to access the specific report.
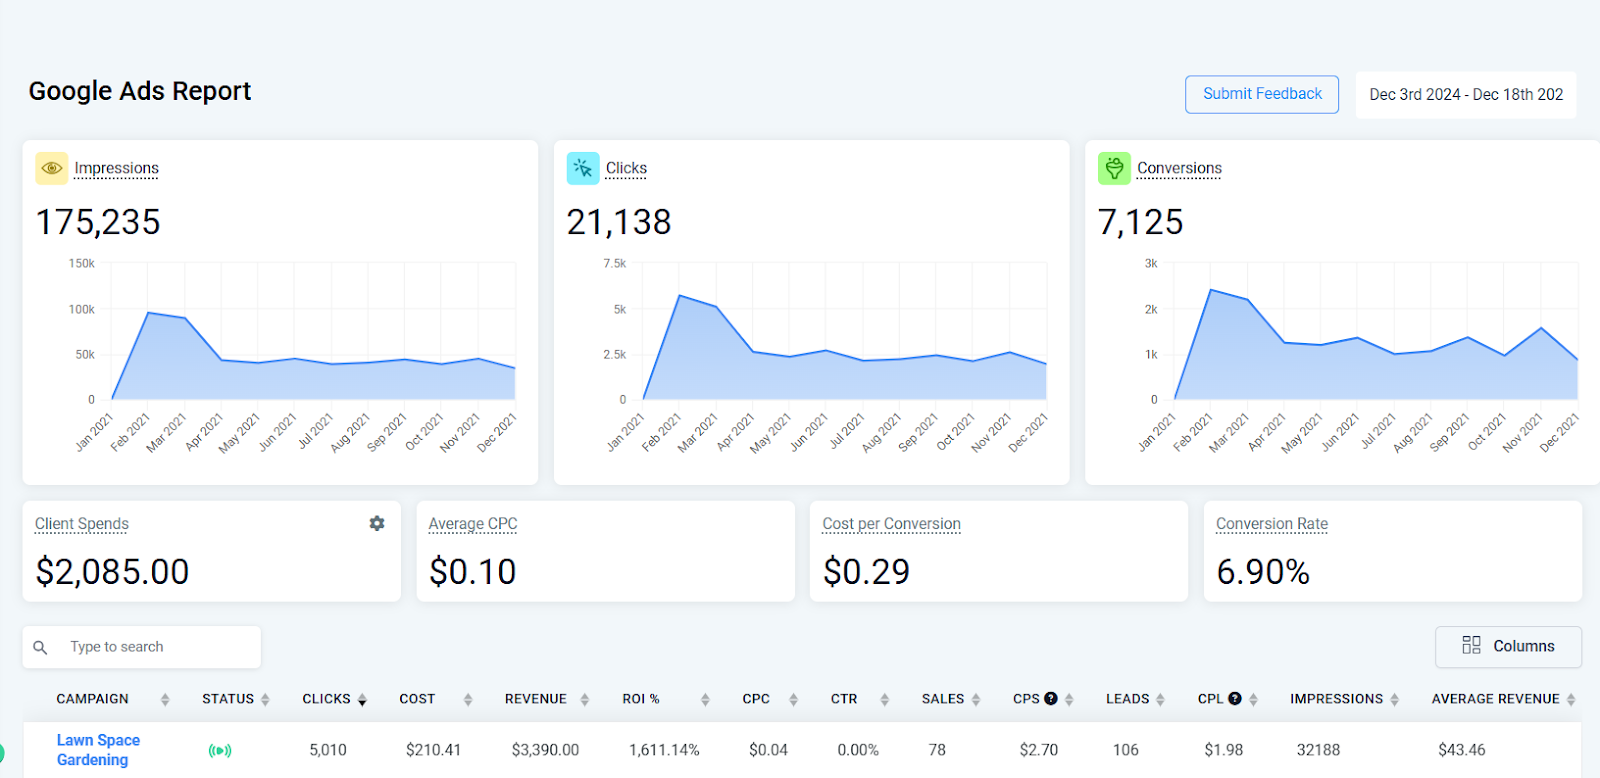
There are several statistics and data points available in this report.
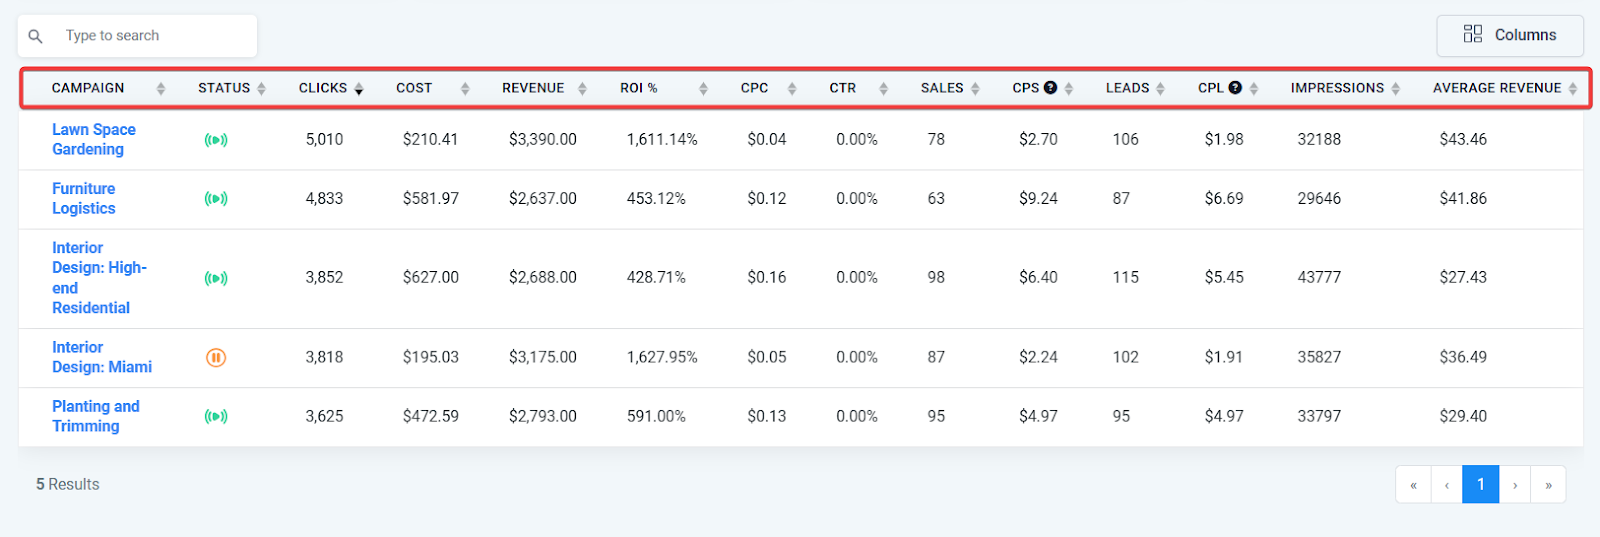
Campaigns, Ad Groups, Ads, and Keywords.
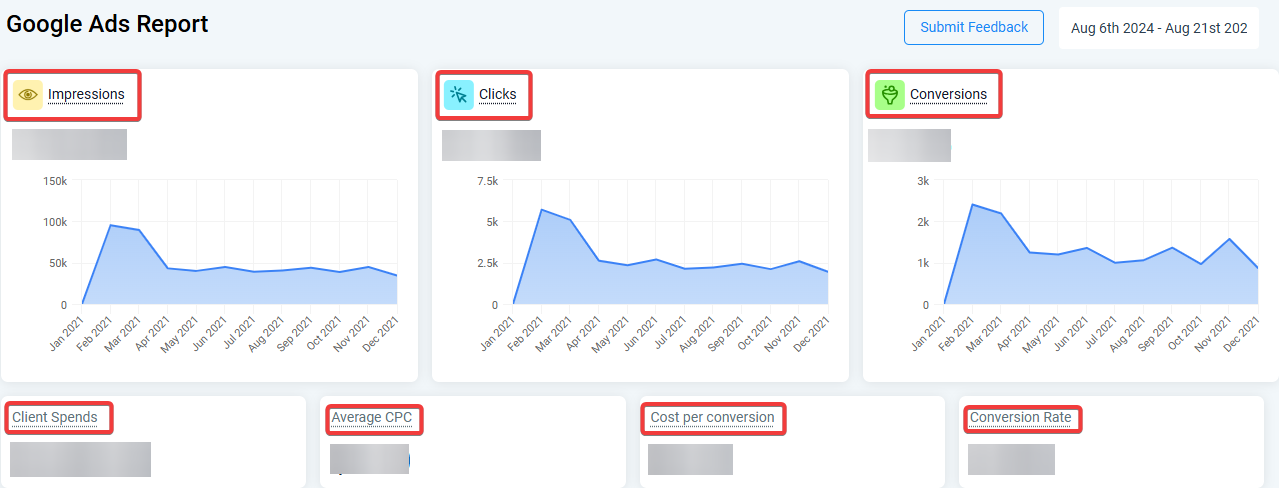
Next, you can review statistics on Client Spends, Average CPC, Cost per Conversion, Conversion Rate, and more.
Check back anytime and refresh the data to check out any time period you wish to see the most updated information and statistics.
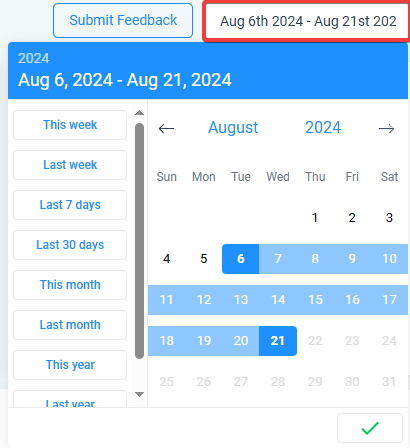
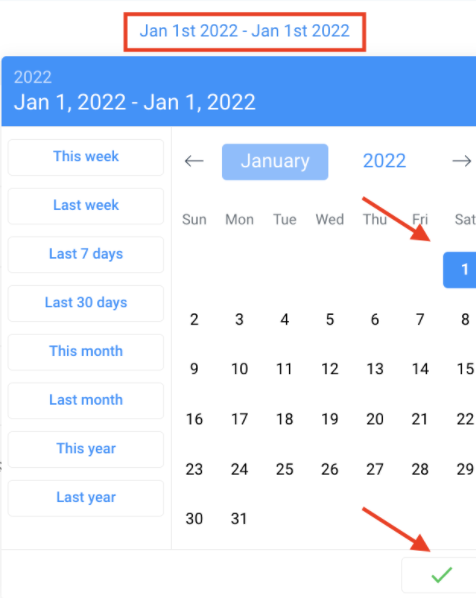
NOTE: If you wish to view reporting metrics for one single day, be sure to check that date as the start and end date. You must have both selected for the stats to appear. The example below shows how you can run reports for January 1, 2022, by choosing January 1st as the start and end date:
Pro Tips:
FAQs
Question: Where can I find graphs for Impressions, Clicks, and Conversions in the report?****
Answer: Graphs for Impressions, Clicks, and Conversions are displayed in the upper section of the report, providing a visual representation of these key performance indicators.
Question: Can I filter the data by Campaigns, Ad Groups, Ads, or Keywords?****
Answer: Yes, you can filter the report data to view specific Campaigns, Ad Groups, Ads, or Keywords. This allows you to drill down into the performance details that matter most to you.
Question: How do I refresh the Google Ads report to get the latest data?****
Answer: You can refresh the report by revisiting it or selecting a new date range. The data will automatically update with the latest information available.
Question: What should I do if the reporting metrics don’t appear for a selected date?****
Answer: Ensure that both the start and end dates are correctly selected. For example, if you want to view metrics for January 1, 2022, choose January 1 as both the start and end date.
Question: How can I compare performance data for different periods within the report?****
Answer: To compare data across different periods, you can select different date ranges and run the report multiple times. This allows you to analyze changes and trends over time.
Question: Do I need admin access on Google Ads to view this report?****
Answer: Yes, the connected Google account must have maximum administrator permissions on Google Ads to access full reporting metrics.
Question: How do I ensure that my Google Ads account is properly integrated for reporting?****
Answer: To ensure proper integration, make sure that the Google account you are connecting is registered on the Google Ads platform and has maximum administrator permissions.
Question: What specific statistics can I review in the report?****
Answer: The report provides data on Client Spends, Average CPC (Cost Per Click), Cost per Conversion, and Conversion Rate, among other metrics.
Question: Can multiple users access the same report?****
Answer: Access depends on user permissions within your account. Users with appropriate reporting access can view the same data.
Question: Does the report show a visual representation of my ad performance?**
**Answer: Yes. The upper section of the report features visual graphs specifically for Impressions, Clicks, and Conversions, allowing you to monitor performance trends at a glance.