¶ Agent Reporting
The Reporting Tab includes a specific report on “Agent Reporting.” This allows you to track information about your team and users within LeadMagicX. Perhaps you have a sales team or other team members you want to view statistics on. Agent Reporting lets you view Opportunities and Conversions, email and SMS stats, and more.
¶ Step 1: Accessing The Report
- Navigate to the Reporting section of LeadMagicX.
- Click “Agent Reporting”.
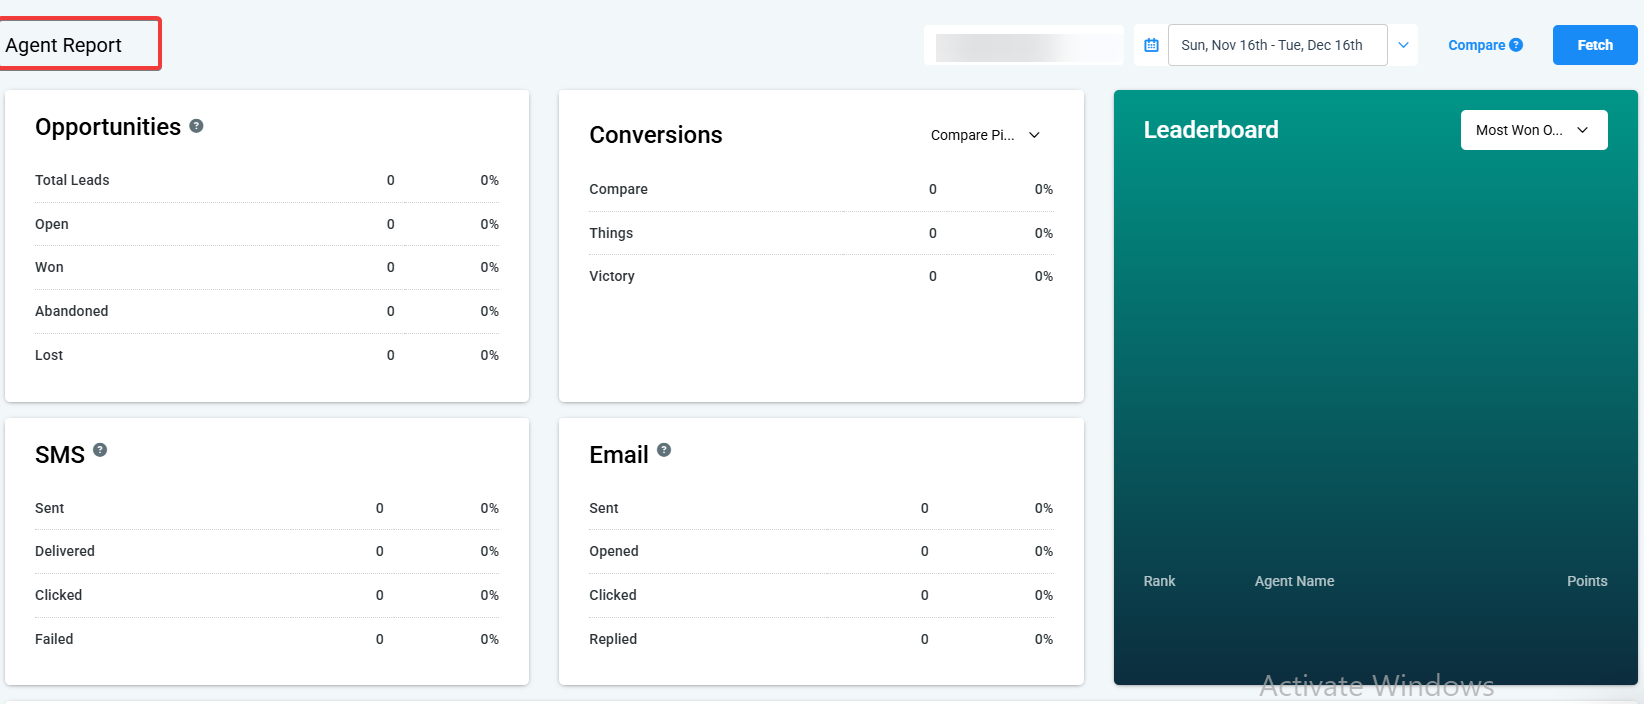
- In the Agent Reporting Dashboard, you’ll see some filters and options in the top right corner.
- You can select one or more team members from the first dropdown list and click “Fetch” to grab the data for the selected team member(s).
- Then, choose a date period. If you click “Compare,” you may select another date or period.
- NOTE: This is useful if you want to compare metrics against more than one time period.
¶ Step 2: Viewing The Report Data
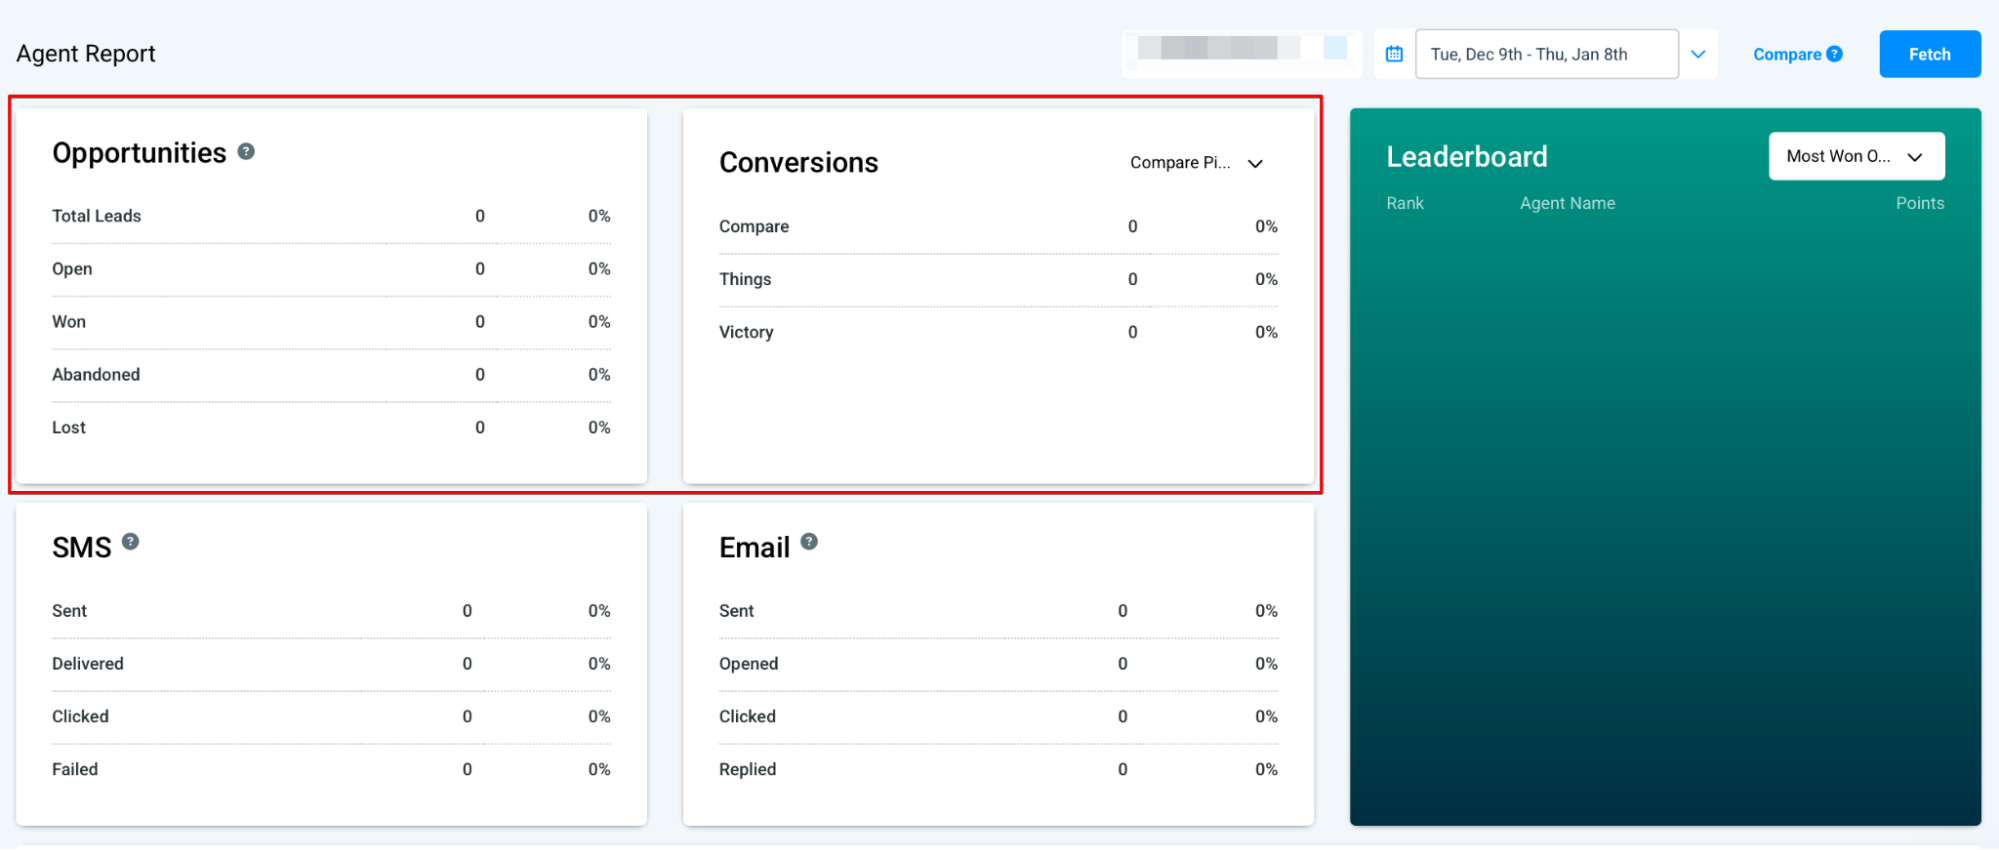
- Multiple data boxes allow you to view metrics for Opportunities, Conversions, SMS, and Emails.
- NOTE : For Conversions, you may select a specific pipeline from the dropdown menu to view conversions for a specific pipeline.
- Also note that the SMS and Email data does not include automation SMS and Email communications, such as those sent via a campaign or workflow
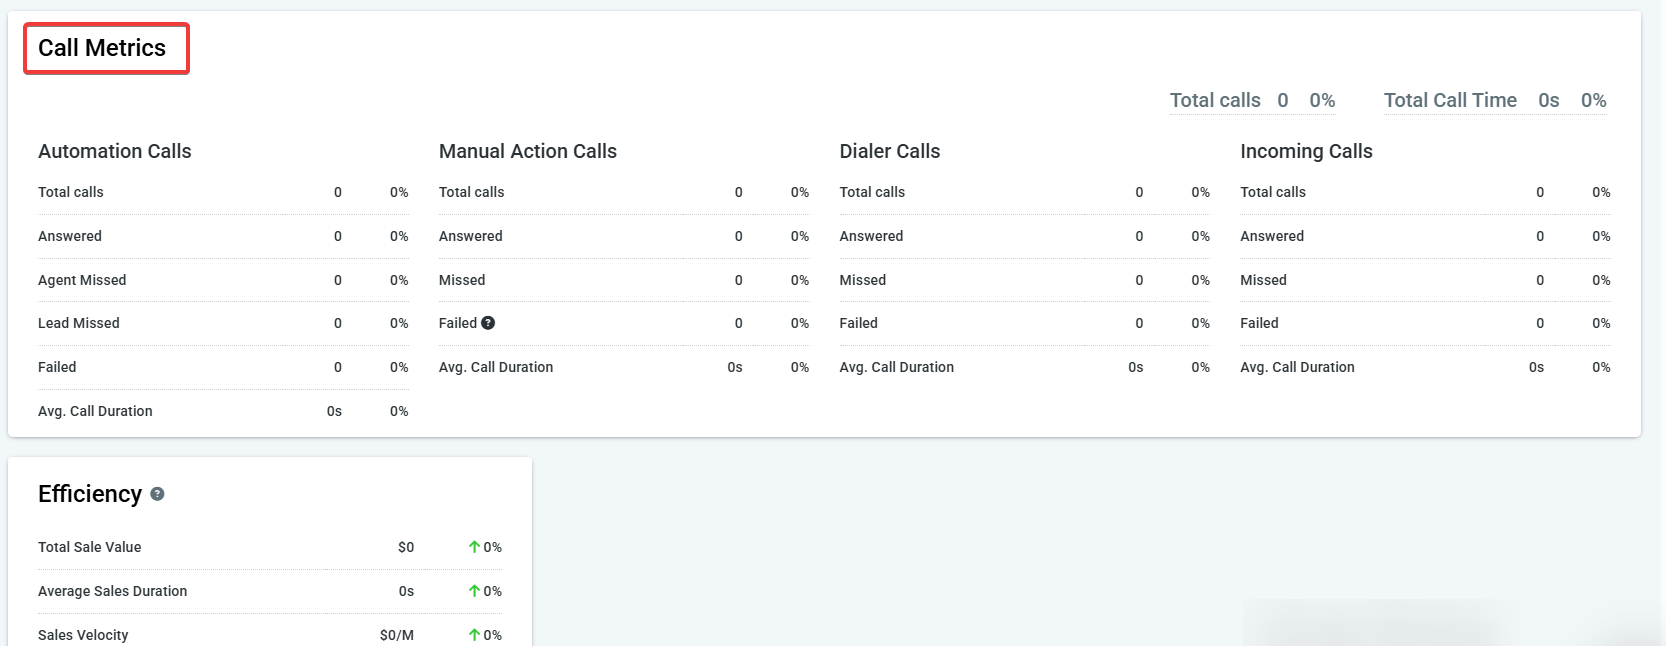
- Call Metrics show all the available call metrics side by side, allowing you to compare automation calls, manual action calls, dialer calls, and incoming calls.
- The Efficiency box shows your total sales value, average sales duration, and sales velocity.
You may visit this reporting section as often as possible, updating the filters, time frame, comparison information, and more. Check back to view how your numbers and stats change over time!
NOTE: If you wish to view reporting metrics for one day, check that date as the start and end date. You must have both selected for the stats to appear. The example below shows how you can run reports for January 1, 2022, by choosing January 1st as the start and end date:

¶ FAQ
Question: How can I access the Agent Reporting section?**
**Answer: To access the Agent Reporting section, navigate to the Reporting section of LeadMagicX and click “Agent Reporting.” This will open the Agent Reporting Dashboard, where you can view and filter your team’s data.
Question: What metrics can I view in the Agent Reporting section?**
**Answer: In the Agent Reporting section, you can view Opportunities, Conversions, SMS, and Email metrics. Additionally, you can check call metrics, efficiency, and sales performance.
Question: Can I compare data from different periods?**
**Answer: Yes, you can compare data from different periods. Use the “Compare” feature to select another date or period alongside your primary date range for comparison.
Question: Are automated SMS and Email communications included in the report?**
**Answer: No, the SMS and Email data in the report does not include automation communications such as those sent via campaigns or workflows. It focuses on individual SMS and Email metrics.
Question: Can I filter the report by individual team members?**
**Answer: Yes, you can filter the report by selecting one or more team members from the dropdown list in the top right corner of the Agent Reporting Dashboard. Click “Fetch” to retrieve the data for the selected team member(s).
Why don’t I see any data when I select a single day for the report?
Answer: To view data for a specific 24-hour period, you must select that specific date as both the Start Date and the End Date. If these do not match or aren’t both selected, the dashboard may appear empty.
Question: How can I view conversion data for a specific sales pipeline instead of looking at my entire account?**
**Answer: Within the reporting data boxes, you can use the dropdown menu specifically for “Conversions” to select the individual pipeline you wish to analyze.