¶ Social Planner Widgets on Dashboard
This article provides an overview of the Social Planner widgets available within the dashboard interface. These tools are designed to provide users with great visibility into social media performance, allowing for data-driven decisions through aggregated analytics without navigating away from the primary workspace.
¶ Key Features and Benefits
The integration of social analytics into the dashboard offers a centralized way to monitor digital presence across multiple channels.
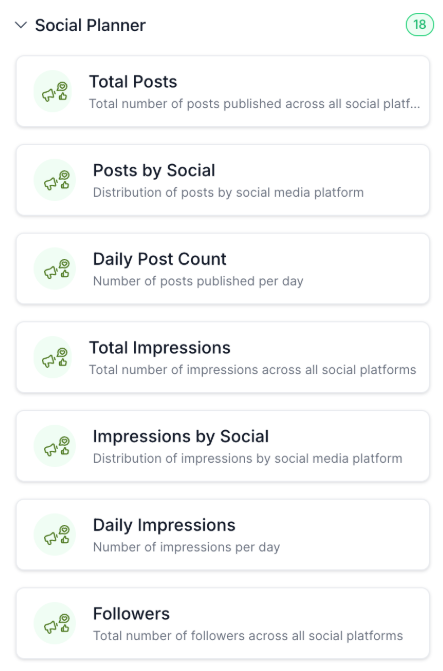
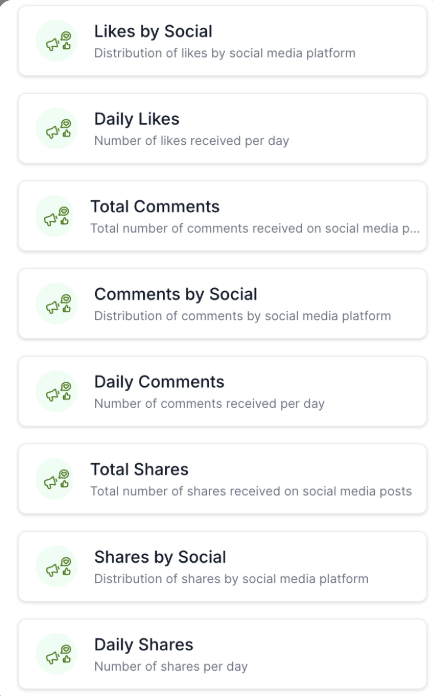
- Aggregated Metrics: Track essential performance indicators including Total Posts, Likes, Comments, Shares, Impressions, Reach, and Follower counts.
- Customizable Filtering: Narrow down data by specific social platforms, individual social accounts, or custom date ranges to identify trends.
- Flexible Grouping: Organize your data views by date, platform, or specific social accounts for better comparative analysis.
- Scalable Reporting: Built on a unified reporting API, these widgets ensure consistent data across custom reports, snapshots, and templates.
- Instant Visibility: Saves time by providing a “snapshot” of social health directly on the main dashboard, eliminating the need to generate manual reports.
¶ How to Use Social Planner Widgets
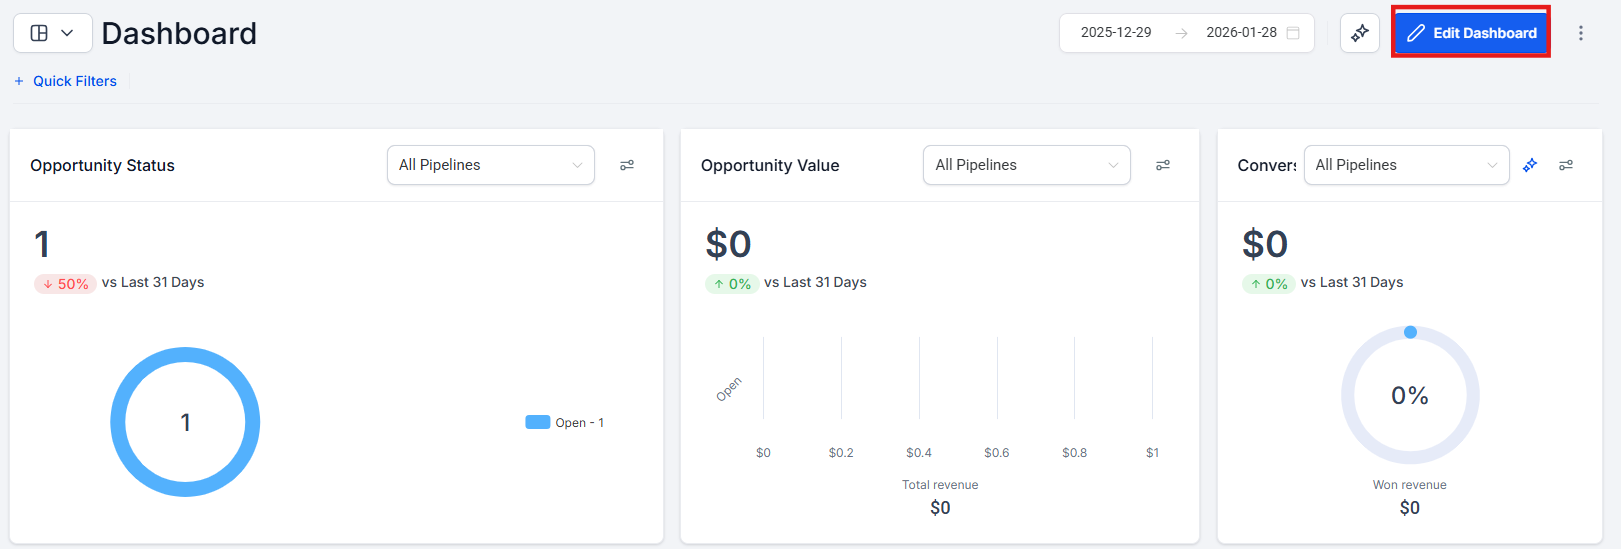
- Navigate to your Dashboard within LeadMagicX.
- Select the option to Edit Dashboard or Add Widget.
3. Choose the Social Planner category from the available widget library.
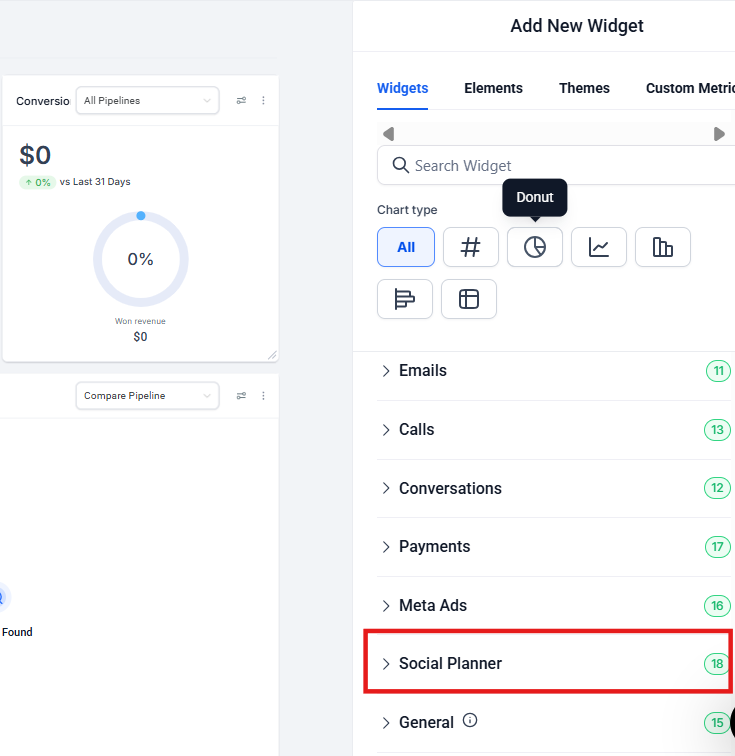
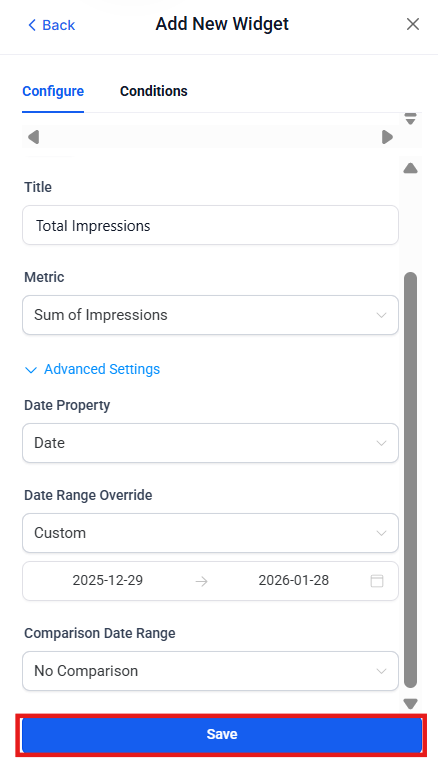
4. Select the specific metric you wish to display (e.g., Likes or Impressions).
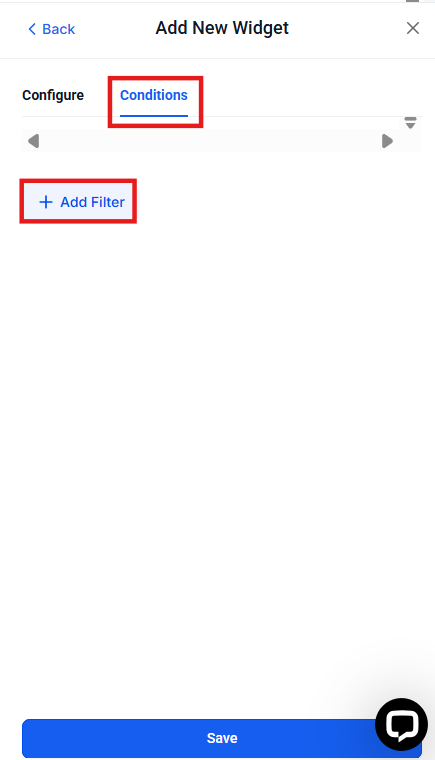
5. Configure your Filters by selecting the desired platforms, accounts, and date ranges.
6. Choose your Group By preference to determine how the data is visualized.
7. Save the widget to your dashboard to begin tracking real-time performance.
¶ Pro Tips & Important Notes
- Numeric Widgets: For a clean, minimalist look, use numeric widgets to display “Total Reach” or “Total Followers” as a single, bold data point.
- Snapshot Compatibility: These widgets are compatible with account snapshots, meaning you can pre-configure social dashboards and deploy them across multiple sub-accounts instantly.
- Data Limitations: Please note that post-level metadata (such as specific post names, images, or descriptions) is not currently displayed within these widgets.
- Excluded Filters: To maintain high performance and accuracy, certain granular filters like post tags, status, or source are automatically excluded from the reporting API at this time.
¶ FAQs
Question: Which social metrics can I track on my dashboard?
Answer: You can track aggregated data for posts, likes, comments, shares, impressions, reach, and total followers.
Question: Can I see the specific image or text of a post within the widget?**
**Answer: No, these widgets focus on great numerical analytics. Post-level metadata such as images, names, and descriptions are not included in the dashboard view.
Question: Are video views or link clicks supported in these widgets?**
**Answer: Currently, advanced engagement metrics like video views, specific link clicks, and subscriber growth trends are not supported, though they may be considered for future analytics expansions.
Question: Can I filter my social data by a specific date range?
Answer: Yes, the widgets support configurable date range filters, allowing you to see performance over specific days, weeks, or months.
Question: Why can’t I filter my dashboard widgets by post tags or post status?
Answer: To maintain high performance and data accuracy, granular filters like post tags, status, or source are currently excluded from the reporting API used by these widgets.