¶ Contacts Widgets In The Dashboard
Contacts widgets are customizable data visualization tools that empower users to efficiently analyze and present their data, enhancing insights and reporting capabilities. These widgets allow users to track various contact metrics and gain deeper insights into their contact data.
¶ How to Use Contacts Widgets
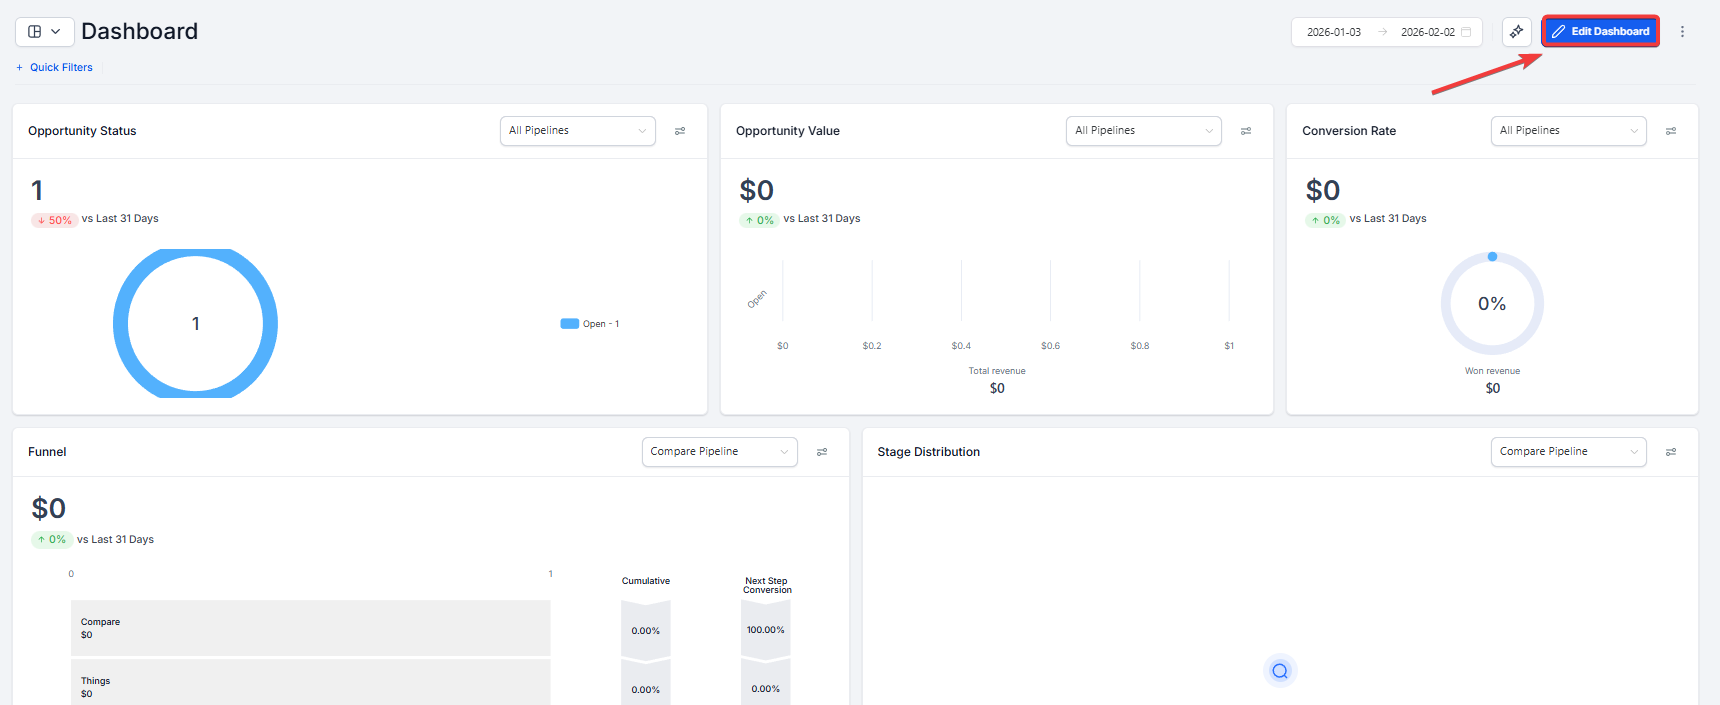
- Access the Dashboard:
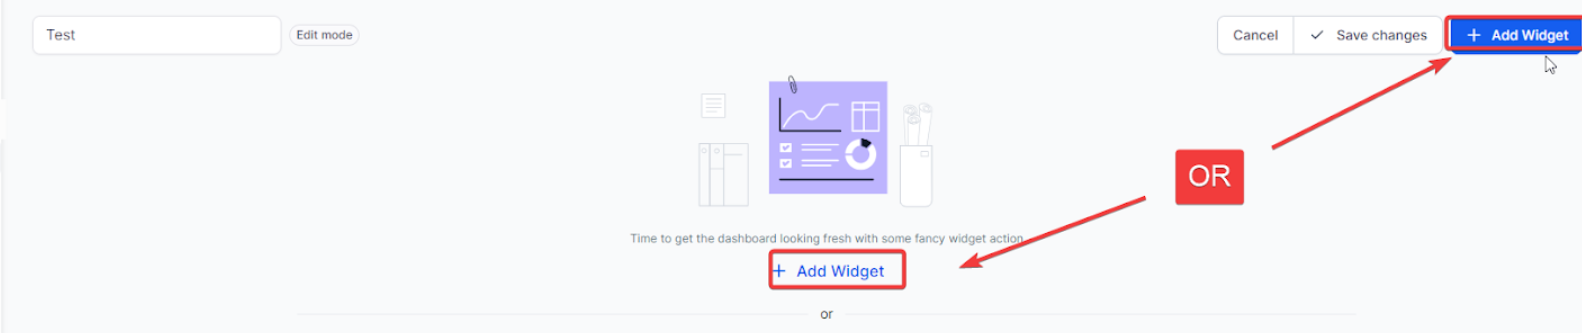
- Navigate to your Dashboard. Click on ‘Edit Dashboard’ button at the top right corner.
2. Add a Widget:
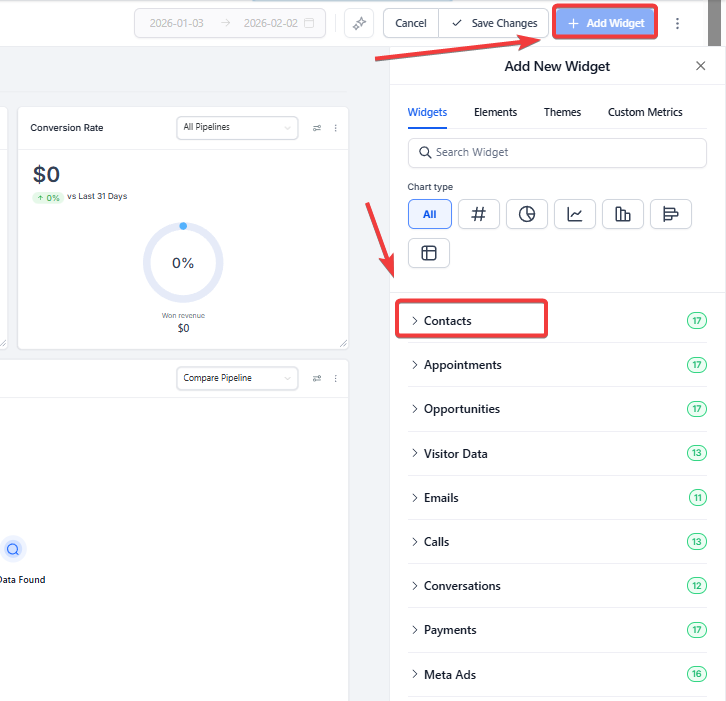
Click on the “Add Widget” button located at the top right corner.
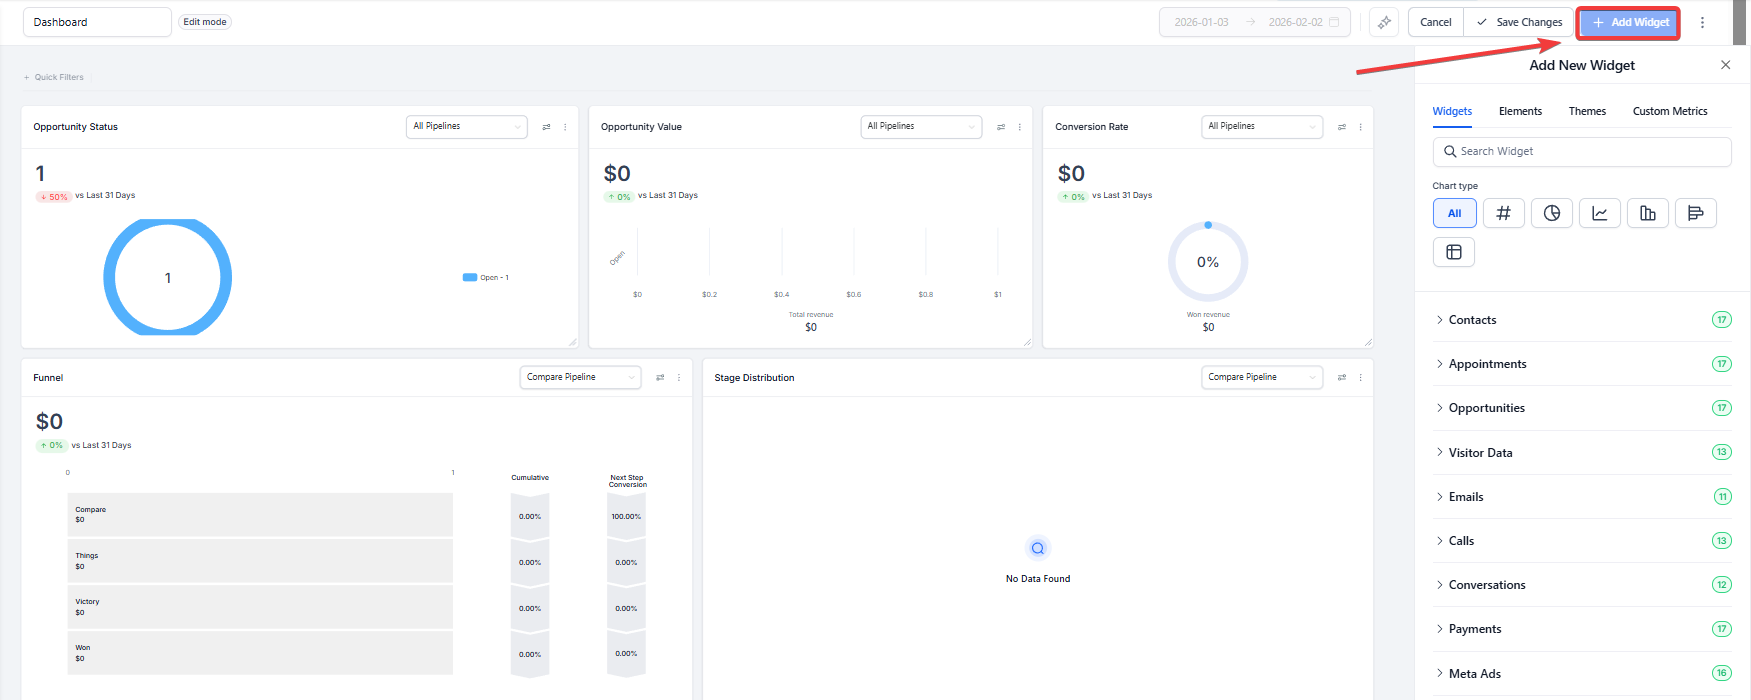
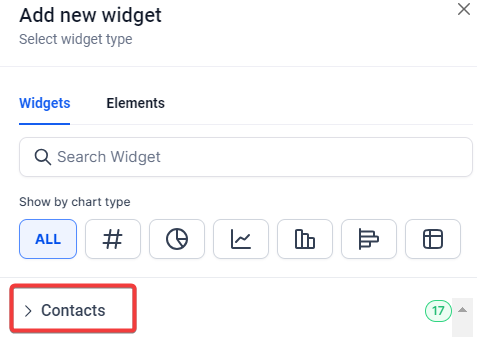
3. Select a Widget Category:
Choose the Contact Category.
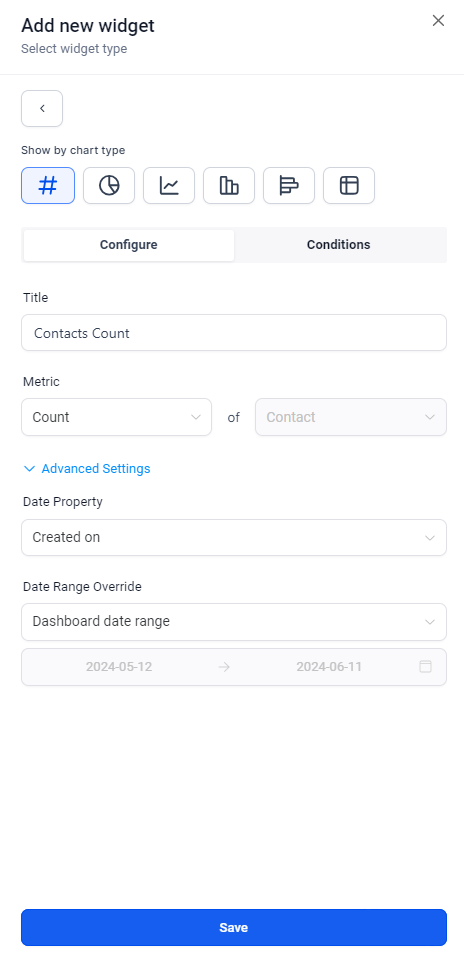
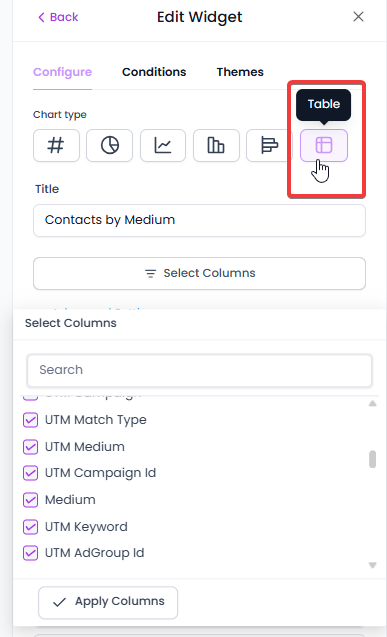
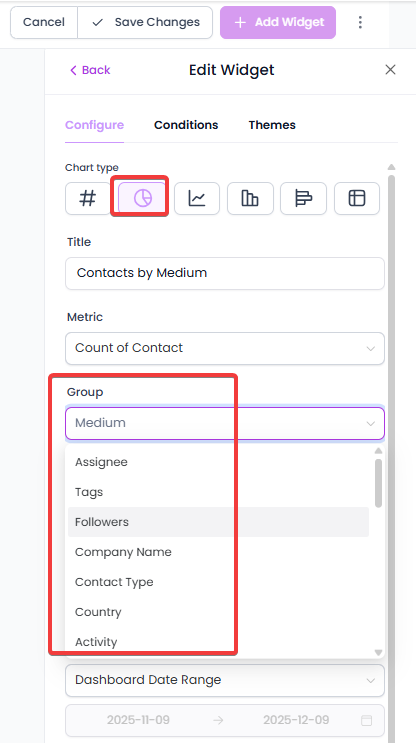
- Configure the Widget:
- Title: Change the widget’s title according to your conditions.
- Metrics: Switch data points for your widget.
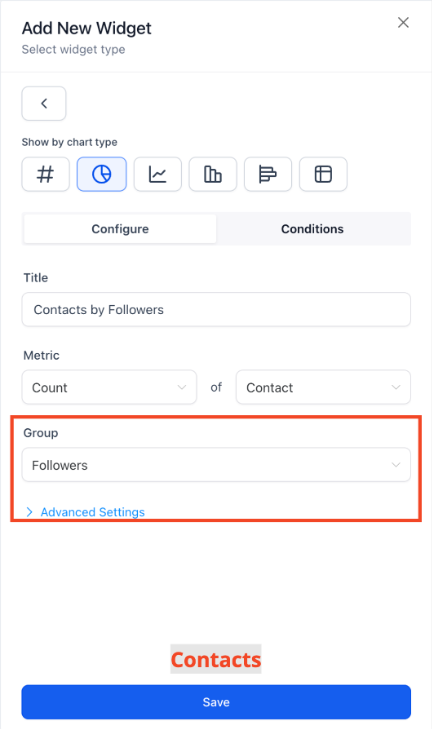
- Group: Define how your results are grouped in a Donut chart.
- View by: Pick the secondary dimension for line, bar, and horizontal bar chart types.
- Breakdown: Modify the frequency of the period.
- Date Property: Adjust the date property for fetching results (e.g., Created Date or Updated Date).
- Date Range Override: Override the date range for the widget for the selected date property (default is the global date range from the dashboard).
- Order: Alter the order of results (ascending or descending).
- Limit: Set a limit to simplify the displayed results.
- Comparison Date Range: Select from options in the dropdown menu to compare data across different time periods: No comparison , Previous 31 days , or Year before.
- Save Your Widget:
- Click “Save” to add the widget to your dashboard.
¶ Contact Widgets Overview
- Contact Count: Provides an overview of the total number of contacts for the entire team.
- Contact Count (Logged in User): Shows the number of contacts assigned to the logged-in user.
- Contacts by Tags: Displays contacts distribution based on tags.
- Contacts by Activity: Tracks the number of contacts with specific activities within a defined period.
- Contacts by Type: Visualizes how contacts are distributed by type.
- Contacts by Assigned User: Shows how contacts are mapped to various team members.
- Contacts by Company Name: Provides insights into contacts by company names.
- Contacts with Email: Tracks the count of contacts with email addresses.
- Contacts without Emails: Monitors the count of contacts without email addresses.
- Contacts with Phone Numbers: Tracks the count of contacts with phone numbers.
- Contacts without Phone Numbers: Monitors the count of contacts without phone numbers.
- Total Contacts Count (Till Date): Shows the total number of contacts created till date.
- Total Contacts Count (This Month): Tracks the total number of contacts created this month.
- Contacts Count (Logged in User): Specifically, count the contacts associated with the logged-in user.
- Contacts by Source: Displays the distribution of contacts based on their source.
- Contacts by Medium: Visualizes contacts based on the medium through which they were acquired.
- Top Sources for Contacts Created: Lists the top sources contributing to the creation of contacts
¶ Sub Account Dashboards: Attribution Parameters on Contacts Widgets
With the addition of Attribution and UTM parameters, users can filter contacts based on first or last attribution and create detailed widgets using key UTM parameters. This allows for enhanced understanding and lead source insights.
¶ How It Works
- Enter Edit Mode on Your Dashboard:
- Click on “Edit” to customize your dashboard.
- Add a Widget:
- Click on “Add widget” under the Contact Category.
- Configure Attribution Parameters:
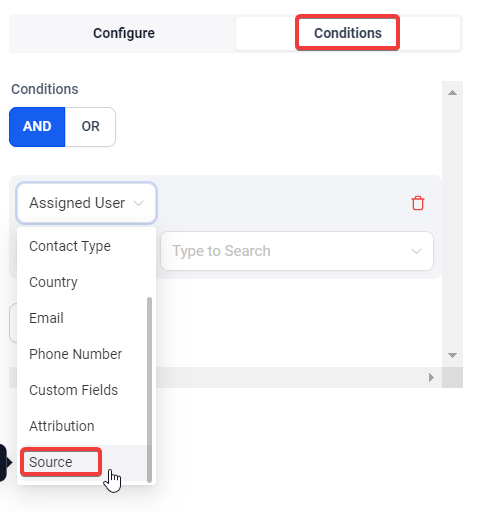
- Switch to the “Condition” tab.
- Choose Attribution and select the attribution type.
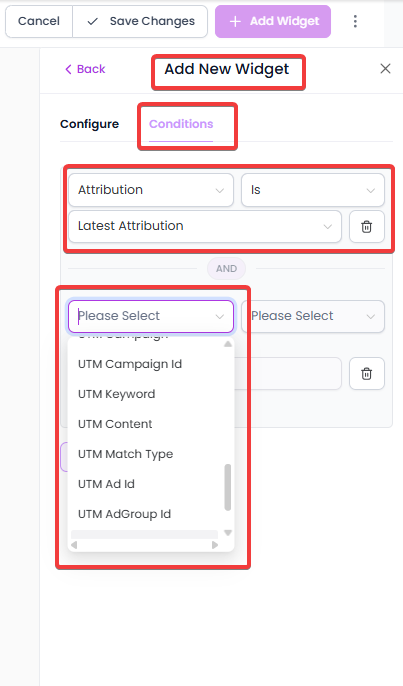
- Click on “Add Attribution Field” and configure the attribution parameter filters as per your requirements.
- Save your changes.
¶ Important Notes
- UTM parameters and fields will only be visible on Table and Granular insights view if Attribution type (First or Latest) is added in widget conditions.
- Group/View by properties - Session Source and Medium can only be selected if Attribution type (First or Latest) is added in widget conditions.
¶ Sub Account Dashboards: Contact Source
The Contact Source filter is a feature added to your dashboard widgets, allowing you to segment and analyze your contact data based on the source from which each contact originated.
¶ Easy Steps to Use the Contact Source Filter:
- Access Your Dashboard : Navigate to your main dashboard.
- Add a New Widget : Click on “Add Widget” and select a widget from the Contacts category.
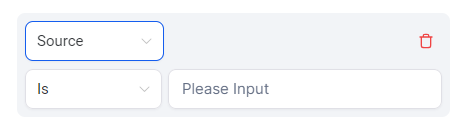
- Apply the Filter : In the Conditions tab, add a new condition and choose “Source” from the dropdown menu.
- Set Your Parameters : Configure the filter settings to specify the contact sources you want to analyze.
- Save and View : Save your changes and view the updated widget on your dashboard.
Additional fields and filters, such asContact’s Address and Contact’s Followers , are available to enhance dashboard functionality and reporting flexibility. These features enable users to segment and visualize data more effectively, creating a tailored view that aligns with specific business needs.
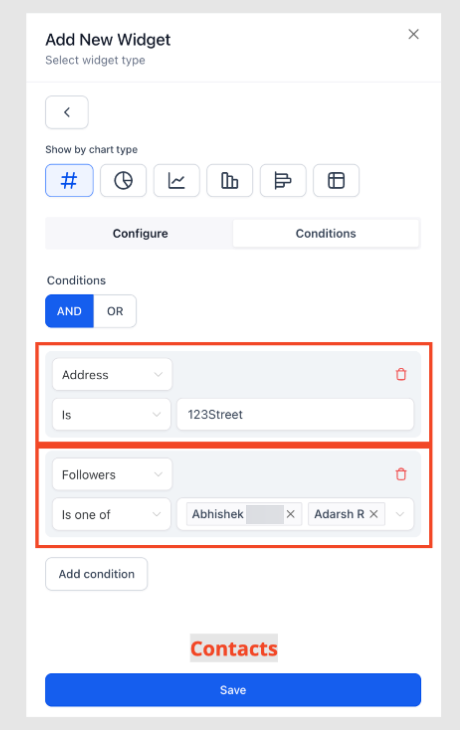
Simply edit any widget in your dashboard, incorporate these fields as filters or columns, and use grouping options to uncover valuable insights.
¶ Use Cases
- Sales Performance Tracking:
- Use the “Contacts by Tags” widget to monitor the performance of different lead categories, such as “Hot Leads” or “New Prospects”.
- Team Performance:
- The “Contacts by Assigned User” widget helps managers track how well team members are handling their assigned contacts.
- Engagement Monitoring:
- Utilize the “Contacts by Activity” widget to see which contacts are most engaged based on their recent activities.
- Marketing Insights:
- Employ the “Contacts by Source” and “Contacts by Medium” widgets to understand where your contacts are coming from and which marketing channels are most effective.
¶ FAQ’s
Question: How do I select the right widget for my data?****
Answer: Choose a widget that best aligns with the type of contact metric you want to analyze. For example, use “Contacts by Tags” for lead segmentation or “Contacts by Activity” to monitor engagement.
Question: Can I track contacts from different sources?****
Answer: Yes, you can use the “Contacts by Source” and “Contacts by Medium” widgets to analyze your contacts based on their acquisition source or the marketing channel they came from.
Question: Can I filter my contacts by first or last attribution?****
Answer: Yes, you can configure your widgets to include attribution parameters like “First” or “Latest” by switching to the “Condition” tab and adding the desired attribution type.
Question: How do I group data in my widget?****
Answer: You can group data in Donut charts or other chart types by selecting the “Group” and “View By” options. This allows you to organize data by different categories, such as contact type, assigned user, or activity.
Question: What if I need to segment contacts based on source?****
Answer: Use the “Contact Source” filter to segment and analyze your contacts based on the source of acquisition, such as email, social media, or referral.
Question: How do I modify the date range for my contact widgets?**
Answer:** You can adjust the date range for your contact widgets by configuring the “Date Range Override” setting. This allows you to override the global date range of the dashboard and set a custom range for the widget, based on specific date properties like “Created Date” or “Updated Date.”
Question: How can I find contacts that are “missing” information?
Answer: Use the “Contacts without Emails” or “Contacts without Phone Numbers” widgets. These are great “Cleanup” tools. If the number in these widgets is high, you know your team needs to spend some time reaching out to leads to complete their profiles.
Question: How do I compare my current contact growth to the previous month?
Answer: In the widget configuration, use the “Comparison Date Range” dropdown. You can select “Previous 31 days” or “Year before” to see how your data stacks up against past performance.